Developed an interactive Social Media Marketing Analytics Dashboard using Power BI, leveraging Power Query for data transformation and DAX for advanced KPI calculations. The dashboard provides insights into campaign performance, audience engagement, and demographic targeting to support data-driven marketing decisions.
I got this dataset from kaggle
The Power BI file can be Social Media.pbix
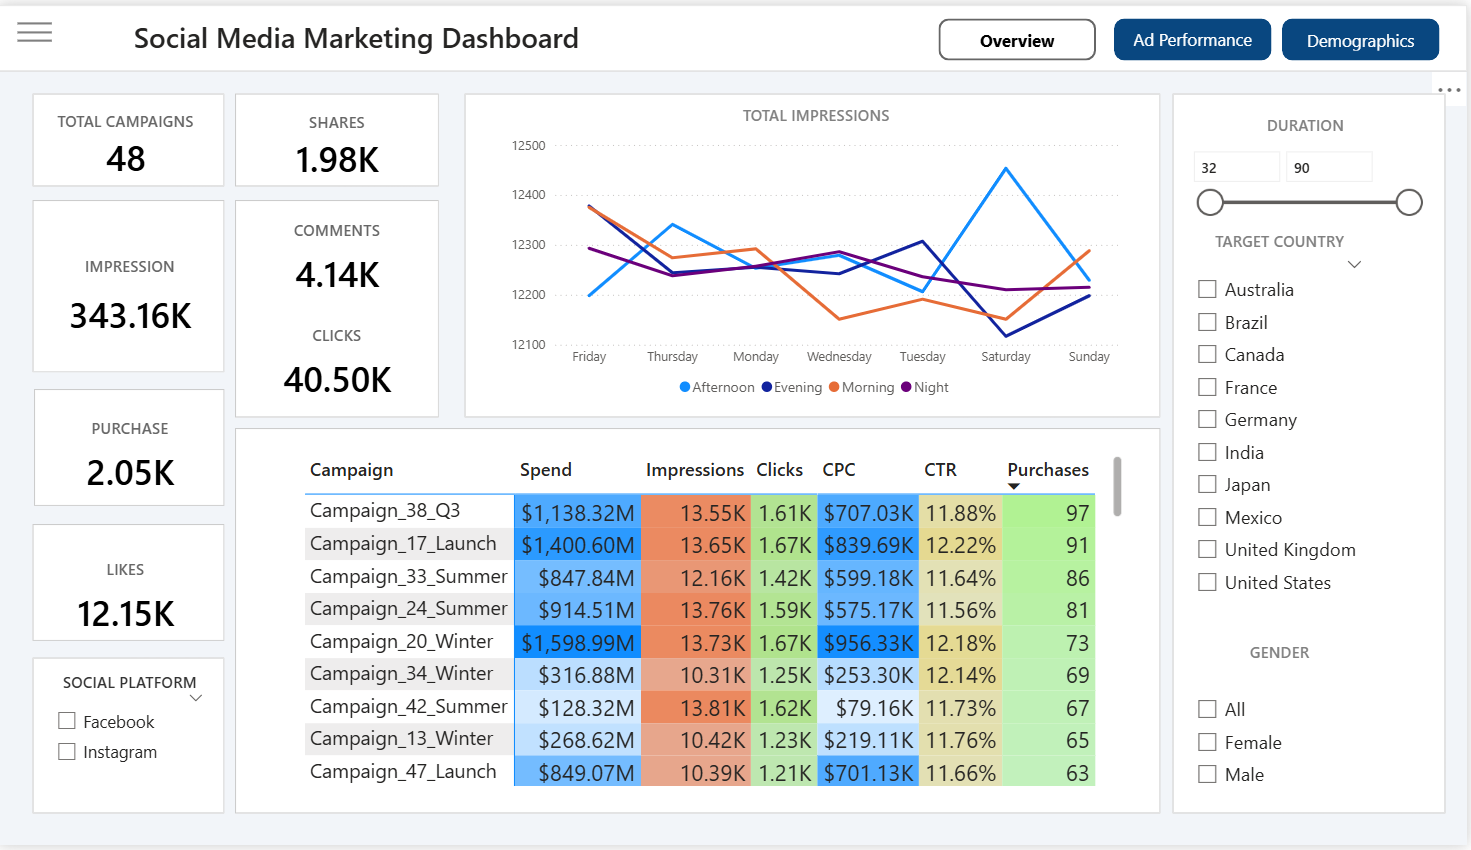
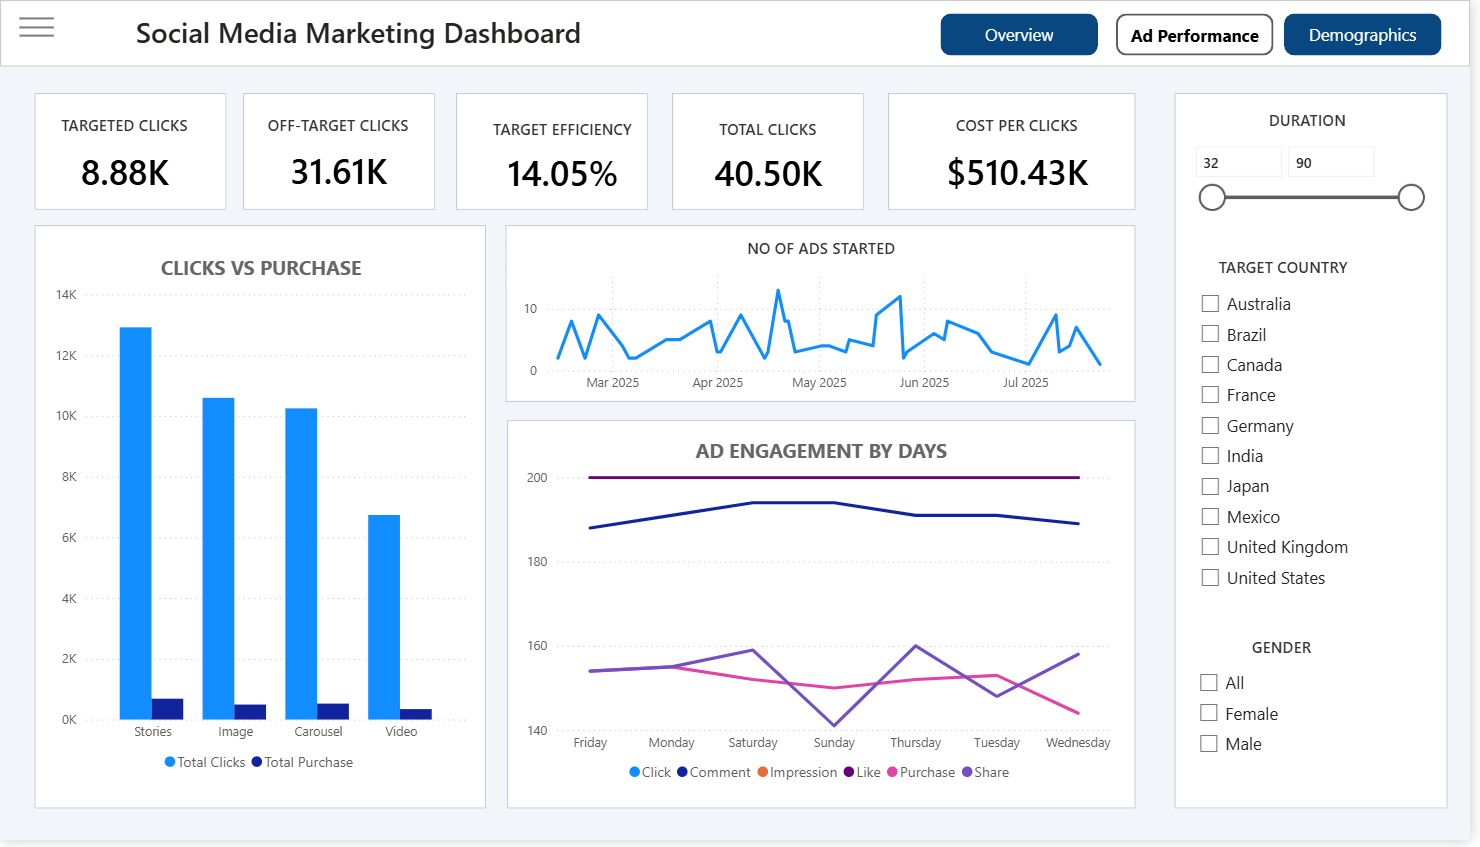
These are my results from my data.
-
- Total Campaigns: 48
- Impressions: 343K+
- Clicks: 40.5K
- Purchases: 2.05K
- Shares, Comments, and Likes tracked for engagement analysis
- Ad Performance Analysis:
- Click-through rate (CTR) and cost-per-click (CPC) evaluation
- Comparison of clicks vs purchases across ad formats (Stories, Image, Carousel, Video)
- Trend analysis of ad engagement over time
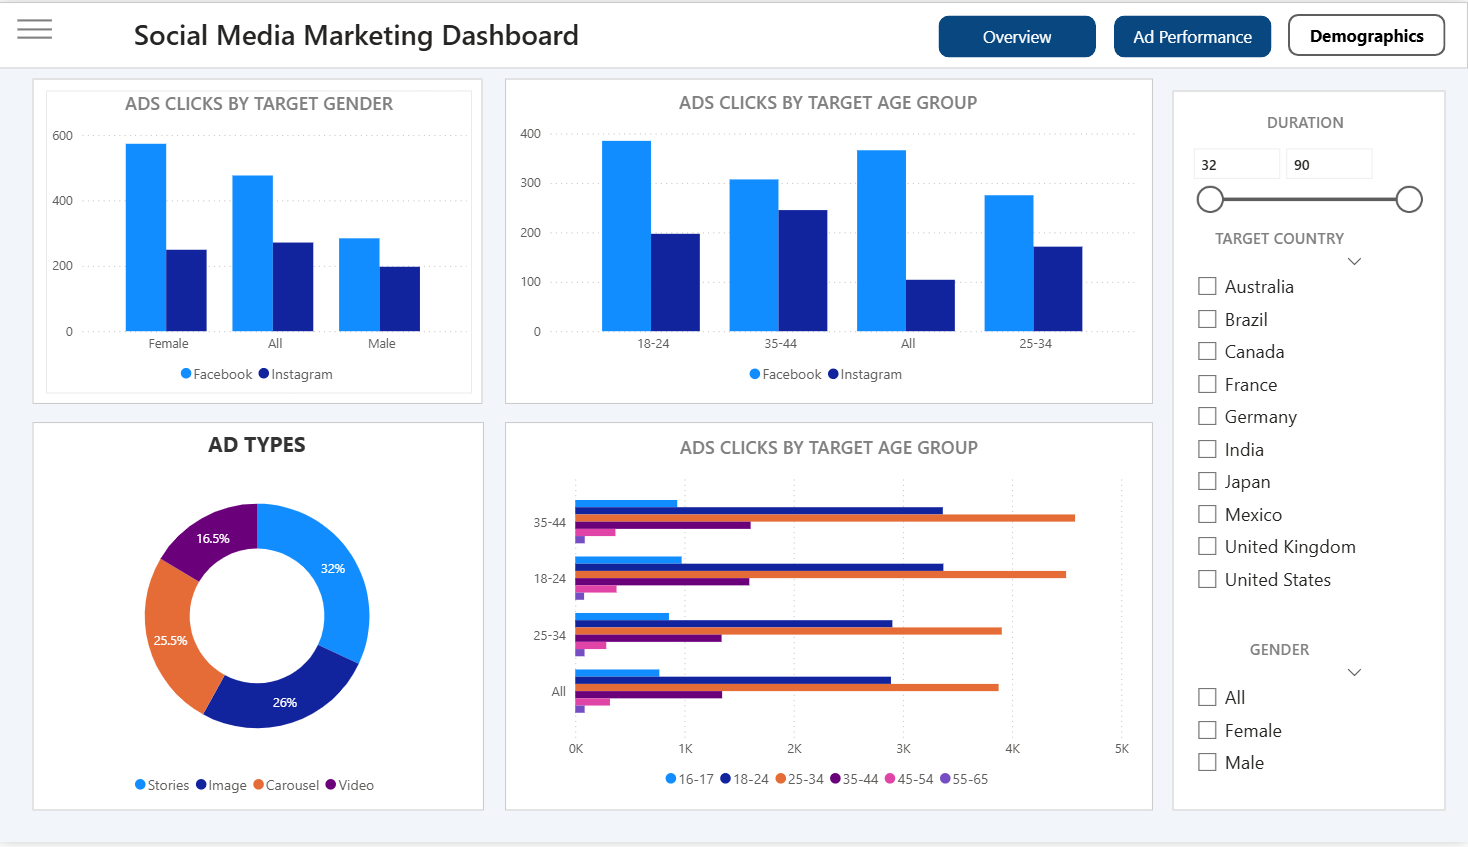
- Audience & Demographics:
- Performance breakdown by gender and age groups
- Identification of high-performing audience segments
- Country-level targeting insights
- Campaign Insights:
- Spend vs performance analysis across campaigns
- Identification of top-performing campaigns and optimisation opportunities
- Interactive Features:
- Filters for target country, gender, platform, and campaign duration
- Multi-page navigation (Overview, Ad Performance, Demographics)
- Drill-down capabilities for deeper analysis